Introduction
In most roll-to-roll applications, the web is guided based on the edge position of the material. Often this alignment based on web edge is sufficient. However, in certain applications the alignment may be based on a feature on the web that is not the edge. In some converting applications the web is guided based on a continuous printed line or a continuous contrasting feature on the material. Line guiding and contrast guiding applications are common in converting processes related to printing, coating, slitting and lamination.
When the guiding is not based on the edge, traditional edge sensors (infrared, ultrasonic or pneumatic) cannot provide the desired web position measurement based on a line or a contrasting feature on the web. In these scenarios, expensive camera based sensors are employed. However, the Roll-2-Roll® Sensor technology provides a simple and cost effective solution for contrast guiding applications. A previous white paper demonstrated the contrast sensing capability of the Web Position Sensor. This white paper discusses the contrast and line guiding performance with the Roll-2-Roll Technologies web position sensor technology.
Contrast Guiding Performance
The contrast guiding performance is evaluated with a compact web guiding system equipped with the ARIS WPS 16 WL sensor. The detailed specification of the parameters of the compact web guide used in these experiments are shown in the table below.
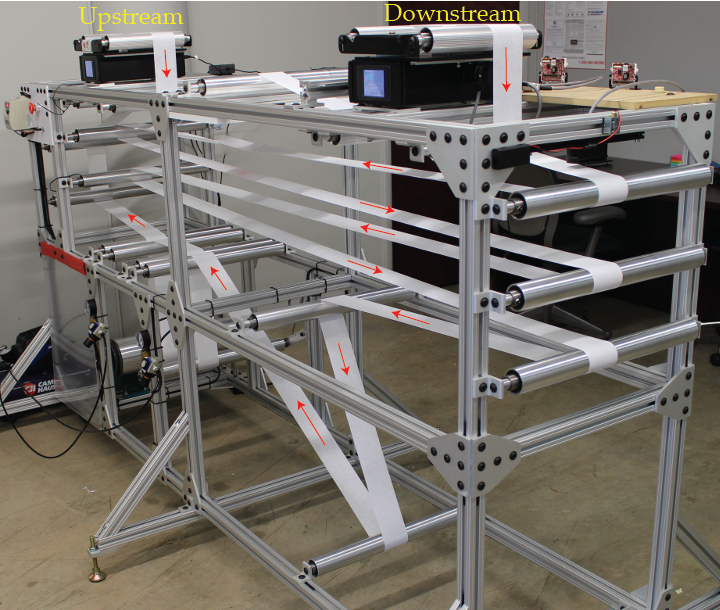
Experimental roll-to-roll machine
An in-house closed-loop roll-to-roll experimental platform (see Fig. 1) is used to evaluate the contrast guiding performance. The length of web material threaded in the machine is about 20 meters and the web can be transported at a speed of up to 10 meters/sec. The web tension in the machine is maintained using a pneumatic dancer system. Webs with 100 mm and up to 450 mm in width can be transported in the machine. The machine is also equipped with two web guides to regulate web position. Two spans with a total length of 1200 mm separate the two web guides. For experimental purposes the upstream guide is used to create disturbances while the downstream guide is used to correct for the disturbances.
A composite web with die cut labels on a clear release liner was transported in the roll-to-roll experimental platform for the experiments. The web was guided based on the die cut edge of the label instead of clear release liner edge. An ARIS WPS 16 WL sensor provided the contrast position feedback to the compact web guiding system.
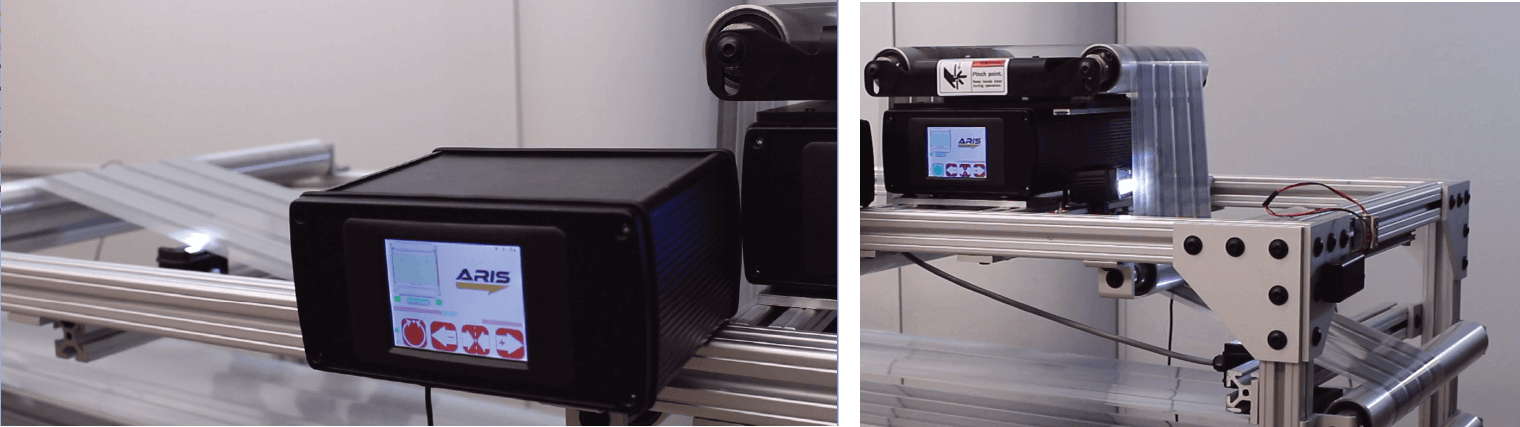
Two additional sensors, with a sensing window of 16 mm (see Fig. 2), were used to measure the contrast position before and after the downstream web guide. These sensors provide a clear quantification of the magnitude of lateral disturbance entering the web guide and the corrective response of the web guide.
Sinusoidal Disturbance Rejection Performance
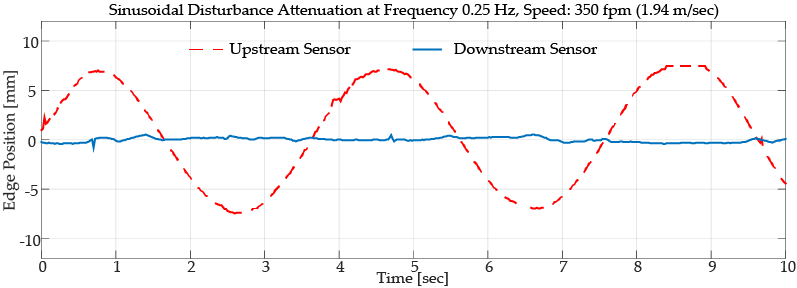
Contrast guiding performance is quantified based on observing the disturbance rejection capabilities of the web guide. Sinusoidal lateral disturbances with a magnitude of 8 mm and frequencies of 0.25 Hz, 0.5 Hz and 1 Hz were introduced with the upstream web guide. The downstream web guide was used to correct the disturbances. The magnitude of the distance entering the web guide and the magnitude of the same disturbance after the correction by the web guide were measured using two additional sensors.
Fig. 3, Fig. 4 and Fig. 5 show a representative sample of results. The web speed in the experiments was 1.94 m/sec and the disturbance frequencies were 0.25 Hz, 0.5 Hz and 1 Hz.
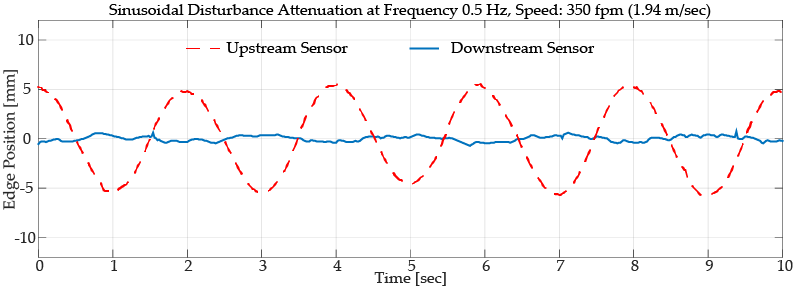
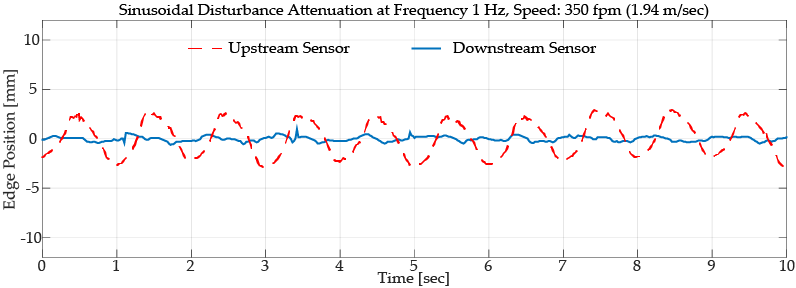
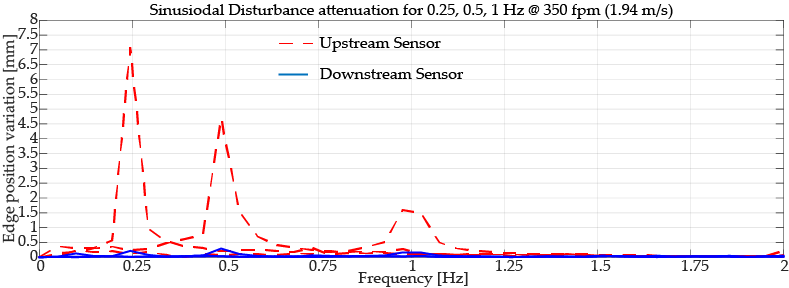
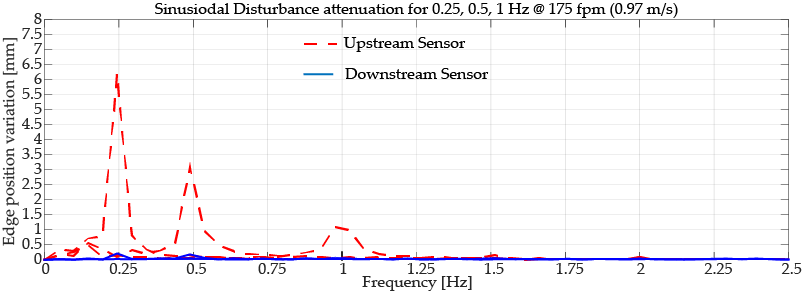
Magnitude of disturbance attenuation at all frequencies were signification as seen from the plots above. The time domain data is further summarized in Fig. 6, which shows the FFT of the contrast position measurement before and after the compact web guiding system. A similar summary for a slower speed of 0.97 m/sec is shown in Fig. 7.
Conclusion
The experimental results show that the contrast guiding performance of the compact web guiding system is similar to the edge guiding performance seen in the previous white paper. The similar performance is attributed to the precision, accuracy and linearity of the ARIS sensor technology for contrast sensing applications. Since the sensor is unaffected by the material properties the performances are similar.

