Introduction
Regulating the lateral position of the web material in a roll-to-roll machine is critical for a wide variety of converting applications. Variations in lateral position can result in substandard finished product. In extreme cases the web material might break because of lateral position variation leading to machine downtime. Roller misalignment, web splices, web thickness variations, roller thickness variations, poor quality input roll, web camber are the primary causes of lateral variations. Even with a perfectly aligned machine with well machined rollers, poor quality raw material (cambered web or webs with thickness variations or with wound roll edge variations) will result in lateral variations. Hence it is necessary to control these variations actively using a web guide system.
Active control of the material's lateral position in manufacturing machines is carried out using intermediate guide or a terminal guide. Intermediate guides, as the name suggests, are used in the middle of the roll-to-roll machine at a location where accurate lateral position control is desired. While terminal guides are used to regulate the position of the raw material fed into the machine or the finished product produced by the machine.
What is a displacement guide or an offset-pivot web guide?
Several types of intermediate guides are used to control the lateral position of the web materials. These include: displacement guide or offset-pivot guide, steering guide, center pivoted guide and end pivoted guide. The latter two guides are rarely used in contemporary machines.
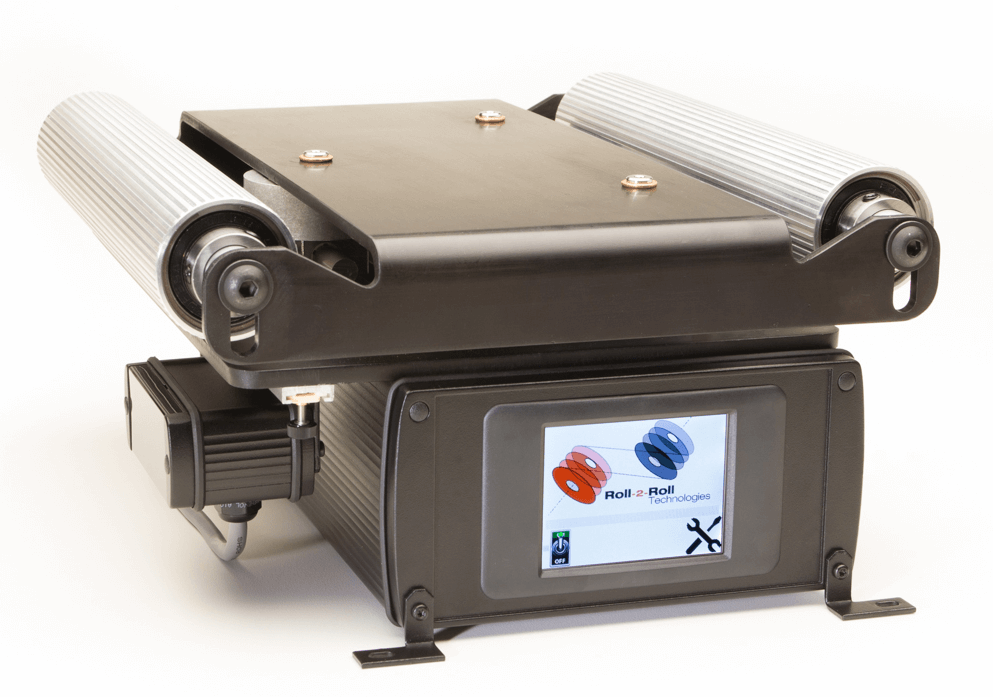
The most common type of a lateral guide is a displacement guide (see Fig. 1). Displacement guides have a pivoting platform with two rollers. The two rollers move in tandem and are always parallel to each other as the web guide platform pivots. Displacement guides are simpler to install and use. If installed properly, the web guide can truly displace the web without introducing bending stresses in the web. This whitepaper deals with the performance of a displacement guide with common disturbances seen in converting lines.
How to quantify web guiding performance?
The performance of a web guiding system is a function of several parameters such as the precision and accuracy of the edge sensor, the precision and accuracy of the guide mechanism, and the speed or the dynamics response of the guide mechanism. The dynamic behavior of the web on the rollers is also an factor that affects the web guide's performance.
Web guide manufacturers typically provide specification of the guiding system without much data about performance quantification. This is mainly because of the fact that the guiding performance is subjective and depends on various process parameters such as web speed, tension, traction, sensor resolution and accuracy, dynamic response of the guide mechanism, etc. Moreover, most of the currently available sensors provide an indirect/inferred measurement which is dependent on the physical properties of the material; quantification based on an inferred measurement is also subjective. However, the web guide used in this whitepaper is equipped with a patented material agnostic fiber optic web edge sensor which provides true, absolute measurement of the web position. Hence a true quantification of the web guiding performance are made easily. The detailed specification of the parameters of the web guide used in these experiments are shown in the table below.
| Specification | Dimension/Value | Units |
|---|---|---|
| Roller Width | 254 | mm |
| Maximum Correction | 52.75 | mm |
| Displacement Resolution | 0.000275 | mm |
| Maximum Linear Speed | 130.00 | mm/sec |
| Maximum Linear Force | 250 | N |
| Sensor Resolution | 0.0635 | mm |
| Sensing Window | 16 | mm |
| Sensing Frequency | 200 | Hz |
| Control Frequency | 50 | Hz |
Experimental roll-to-roll machine
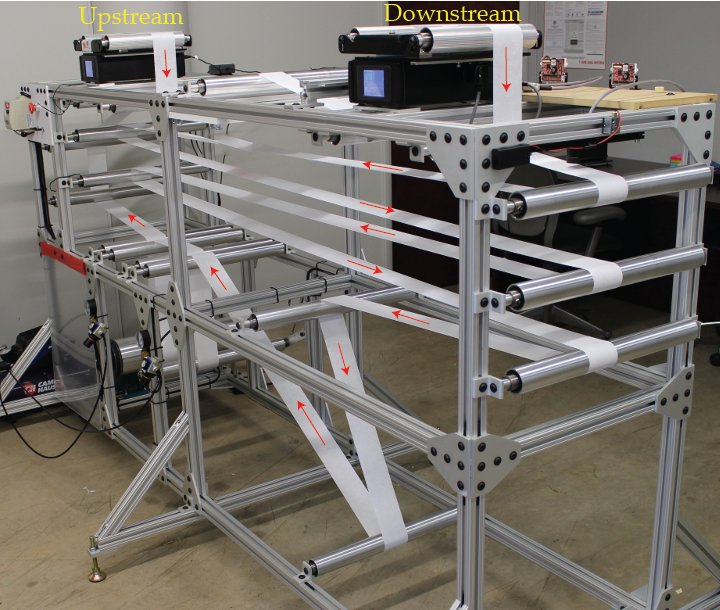
In order to quantify the web guiding performance, we test the web guides in an in-house closed-loop roll-to-roll experimental platform (see Fig. 2). The length of web material threaded in the machine is about 20 meters and the web is transported up to 10 meters/sec. The web tension in the machine is maintained using a pneumatic dancer system. Webs with 100 mm and up to 450 mm in width are transported in the machine. The machine is also equipped with two web guides to regulate web position. Two spans with a total length of 1200 mm separate the two web guides. For experimental purposes the upstream guide is used to create disturbances while the downstream guide is used to correct for the disturbances.
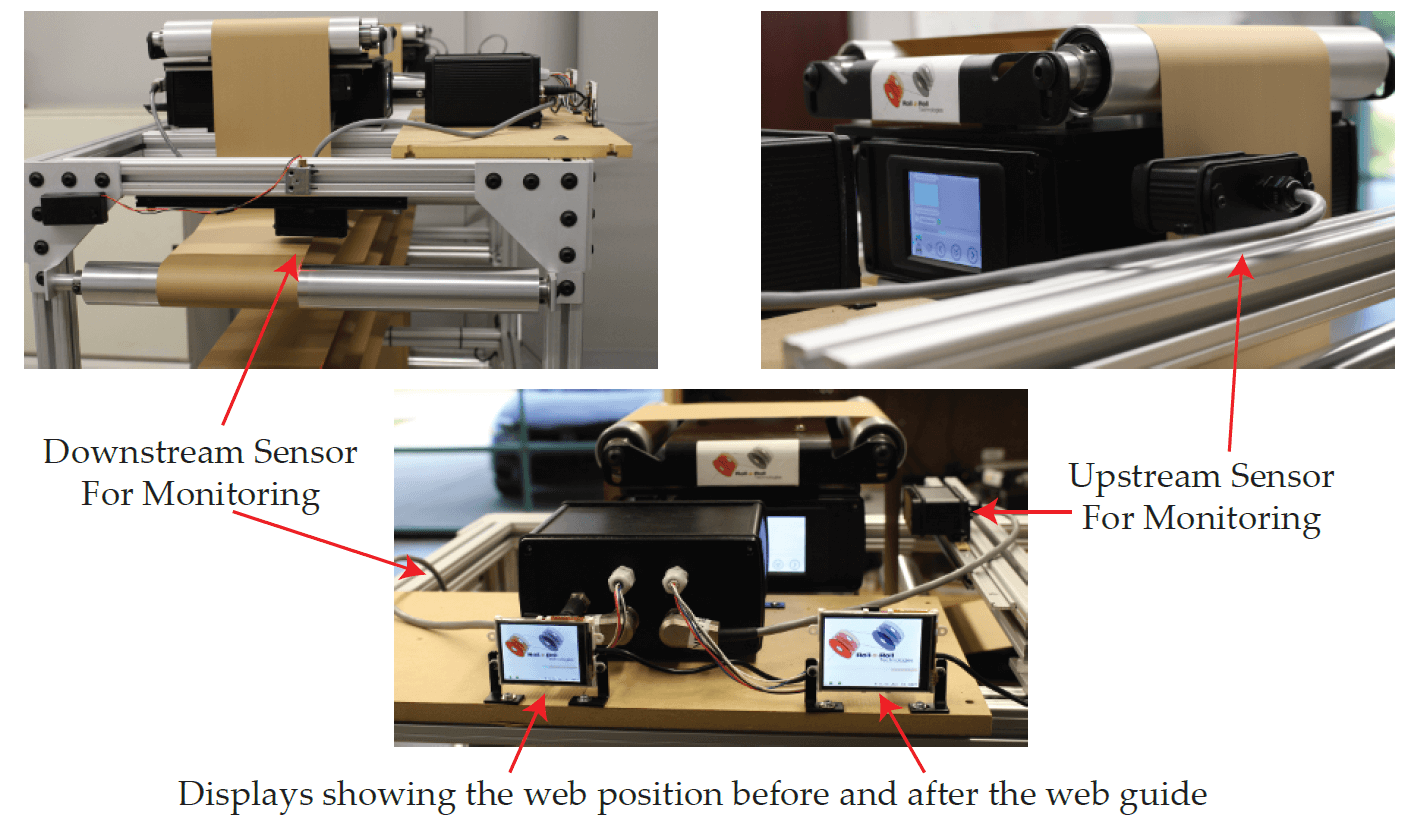
Two additional sensors, with a sensing window of 48 mm (see Fig. 3), are used to measure the lateral position before and after the downstream web guide. These sensors provide a clear quantification of the magnitude of lateral disturbance entering the web guide and the corrective response of the web guide.
Sinusoidal Disturbance Rejection Performance of the Web Guide
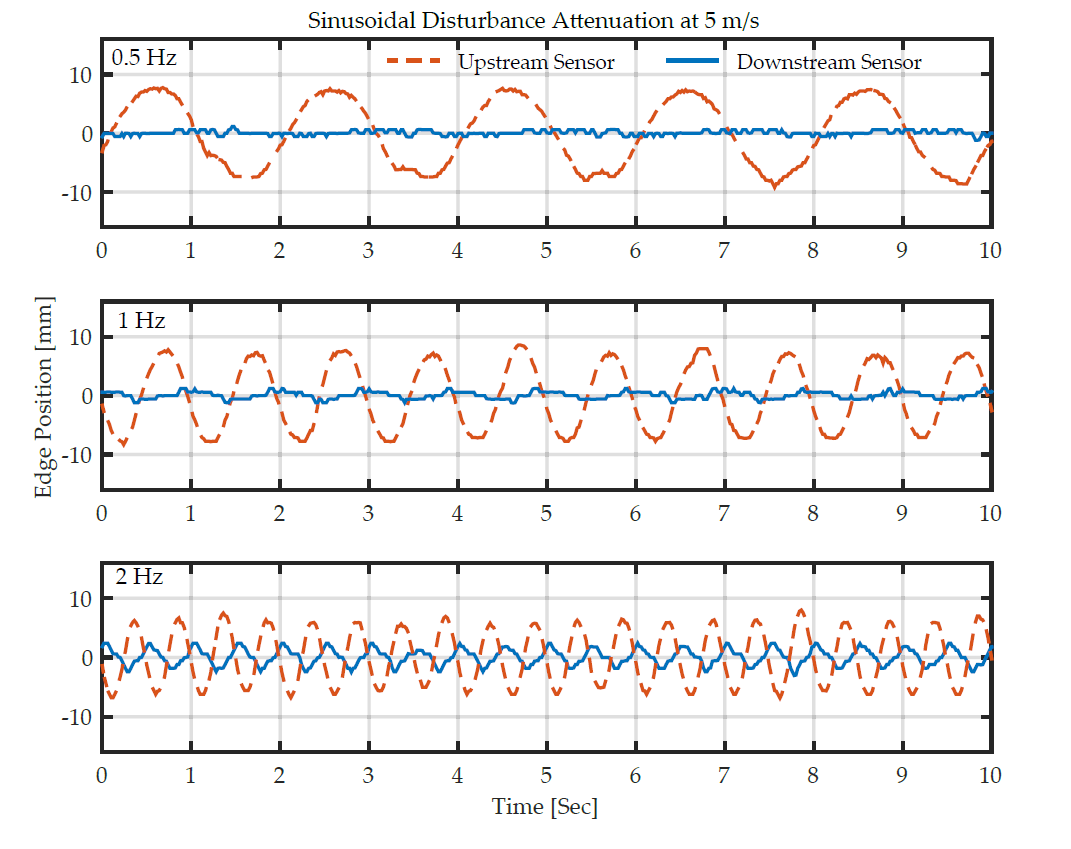
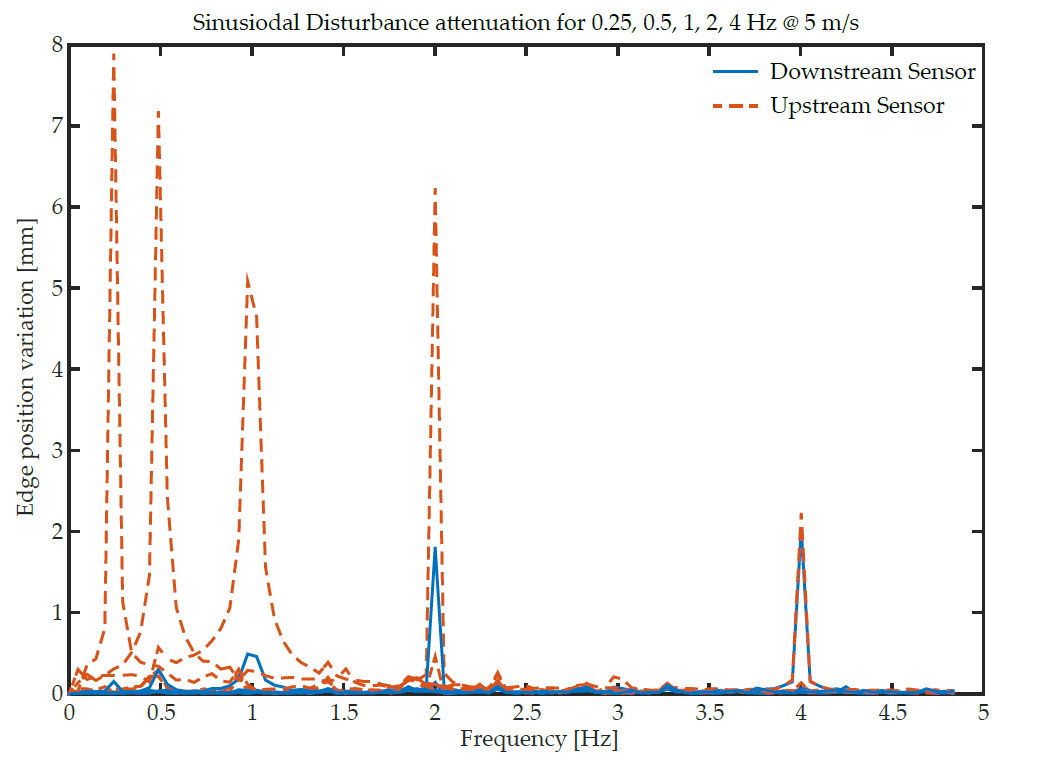
Sinusoidal disturbances are common lateral errors seen in industrial converting machines. Hence the performance of the web guiding system is evaluated for sinusoidal disturbances. In the experiments reported in this white paper, sinusoidal lateral disturbances with a magnitude of 8 mm and frequencies of 0.25 Hz, 0.5 Hz, 1 Hz, 2 Hz and 5 Hz were introduced with the upstream web guide while the downstream web guide is used to correct for the disturbances. Kraft paper with a width of 152 mm was transported in the machine with varying speeds up to about 5 m/sec; tension was maintained in the machine using a passive dancer.
A summary of the time domain results are shown in Fig. 4. All the plots show the disturbance entering the guide roller (measured using the upstream web edge sensor) and the guiding performance of the web guide (measured in the downstream span using a sensor). A FFT of the lateral disturbance and the web guiding performance is shown in Fig. 5 to further summarize the results.
Step Disturbance Rejection Performance of the Web Guide
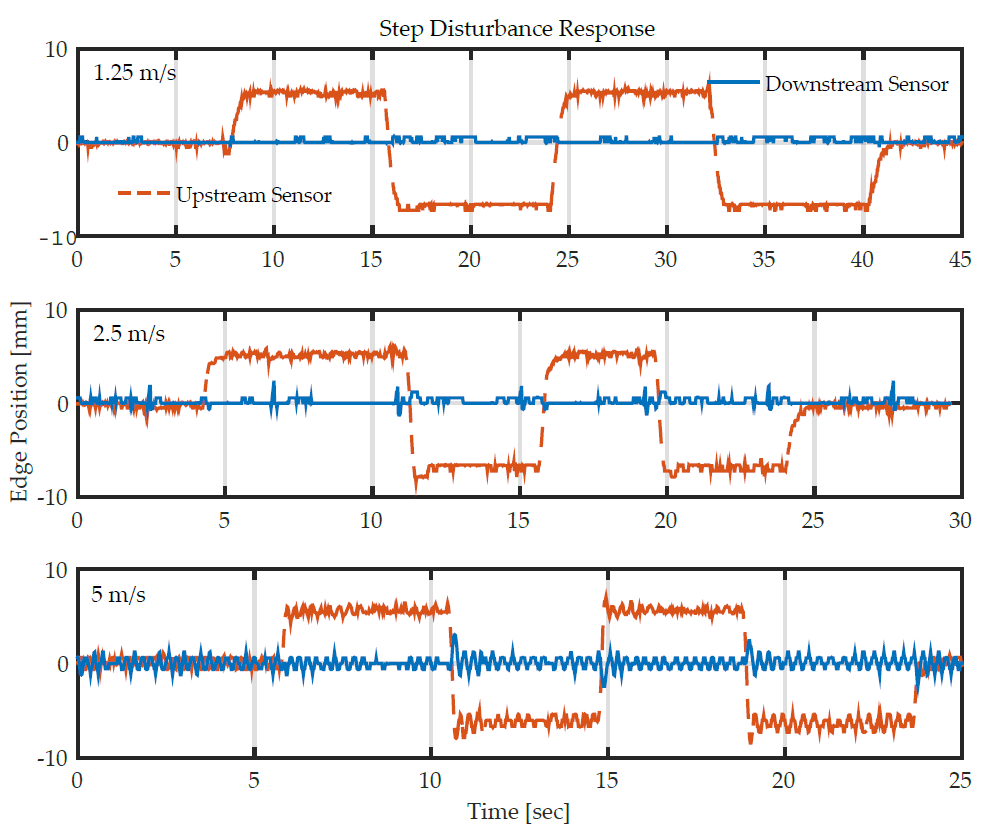
Response to step disturbance is a key performance metric that quantifies the response time of the web guide and the magnitude of attenuation. These types of disturbances are common with web splices or sudden web position changes. Moreover, the step response can theoretically excite all disturbance frequencies. Hence the step response is a good performance metric for performance quantification. Experiments were conducted to evaluate the guide performance of the web guide for these types of disturbances and a summary of results are shown in Fig. 6. The disturbance entering the guide roller is captured by the upstream sensor while the actual lateral position downstream of the guide roller is measured using the downstream sensor.
Summary and Conclusions
From the experimental results it is evident that the web guide provides accurate guiding performance in the presence of both sinusoidal and step disturbances. Significant reduction in sinusoidal disturbances were observed with low frequency disturbances and rapid response to step disturbances were also observed. Further increase in performance in the guiding performance can be obtained with a high dynamics response actuator. This is discussed in another whitepaper.


